Confluence pentest reporting: simple KPIs to track remediation performance
Need to track the remediation of pentest findings? Use confluence reporting tools to stay on top of the game
Penetration testing assessments are essential for companies to identify and resolve security vulnerabilities in their systems and applications. By proactively identifying exploitable weaknesses, software development teams can fix security issues before they become an issue.
However, penetration testing assessments are only half the battle. Remediating security issues on time, effectively and in an auditable manner is the other half. For security teams and upper management, measuring the remediation of penetration testing findings is essential for assessing the effectiveness of a company’s security posture.
More importantly, helping management understand company performance in this area is one of the most high-value activities that security teams can bring to the table. Accurate and timely reporting allows executives to make informed decisions about resource allocation and prioritising security initiatives based on real-world risk assessments. This transparency, if properly managed, can help cybersecurity teams effectively collaborate with management to embed security within the company’s overall goals.
What goals should we aim for?
When reporting remediation performance there are three goals that we should target:
- Uncovering performance trends: The volume of security tickets (and the consequent spike of remediation work) generated by penetration testing engagements can quickly overwhelm security and software development teams. Multiple penetration tests per year can identify hundreds of vulnerabilities (which often overlap), making it time-consuming and error-prone to manually track the status of each remediation task. A single pane of glass and SLA-driven metrics are needed to understand whether the organisation is on top of things and whether performance is trending upwards or downwards.
- Identifying impediments and overdue work: Another challenge is ensuring that impediments and bottlenecks in the remediation of vulnerabilities are identified and weeded out quickly. Especially in large organisations, competing product roadmaps and differing processes can quickly complicate remediation efforts. Furthermore, different reporting tools may use different terminology and formats, making it difficult to compare and aggregate priorities from multiple backlogs. By introducing reports that help quickly identify impediments and bottlenecks, security teams can keep company remediation efforts moving forward.
- Enabling data-driven prioritisation: Cybersecurity teams don’t just need to verify that vulnerabilities are being fixed, they also need to help software development teams prioritise and curate their backlogs. Furthermore, they must help software developers understand if security findings can be efficiently resolved by upcoming upgrades or roadmap changes. Removing (or fixing) stale, overdue or redundant issues will enable the security team to be a driving force behind company backlog refinement efforts.
How can Confluence help us?
Confluence provides a number of out-of-the-box tools that can help organisations track and manage the remediation of penetration testing findings. These tools can help automate the tracking process, centralise data from multiple sources and generate reports that are easy to understand and share.
For example, Confluence can be used to create a simple, yet centralised, report for penetration testing remediation efforts. This makes it easy for teams to share information and track overall remediation progress. Confluence can also be used to create dashboards providing a visual overview of remediation statuses, as well as trend data that can help identify areas of concern.
Confluence can also integrate with JIRA data to help build near real-time reports. This integrated approach streamlines the reporting process, ensuring that teams have access to updated insights into the remediation of security issues.
However, some configuration is required before you can use JIRA and Confluence together to report pentest findings. For starters, JIRA needs to be configured in order to enable the processing of pentest findings at scale.
Once the configuration is complete, integrating JIRA data into Confluence pages is a straightforward process. This can be done by inserting macros within Confluence reports. This is easily done by typing “/jira” or clicking on the “+” icon and selecting “Jira” from the available options. This will open the Jira macro configuration panel for you to integrate JIRA data into a given Confluence page.
To pull JIRA data into Confluence macros, it is sufficient to use JQL (JIRA Query Language) queries to identify the JIRA project containing the vulnerability data you want to report. Once you’ve defined JQL filters the data will start flowing automatically within your charts. You’ll then be able to customise various display options (depending on the macro) to get your charts to display the needed levels of data and granularity.
What KPIs can we use?
There are three groups of KPIs (Key Performance Indicators) that we can use. These KPIs will help your team effectively track remediation efforts while providing upper management with clear, impactful information:
- Average resolution time of penetration testing findings, broken down by severity: These KPIs measure how quickly vulnerabilities are being fixed, taking into account the severity of the vulnerability. This information can help identify areas where teams may need to improve their remediation speed. Additionally, breaking down the data into charts covering individual severity levels will help your team understand if the issues affect remediation efforts more generally (i.e. the company generally fails to meet resolution SLAs across several severity categories) or in specific cases (i.e. the company struggles to meet resolution SLAs for low severity issues as these are frequently left unassigned)
- Another group of useful KPIs are 1) overdue security tickets by squad/team, 2) created vs resolved security tickets and, 3) overdue pentesting remediation projects. These KPIs provide a more granular view of remediation efforts. In particular this information can help identify specific teams who may be struggling to keep up with their remediation backlog. Finally, they can help anticipate and manage spikes in remediation workloads
- Top 10 oldest security issues by squad/team: This KPI highlights the oldest vulnerabilities that have not yet been remediated. This information can help direct your teams’ attention to the most overdue issues and prioritise them accordingly. It can be useful to identify issues to be addressed during “clean up” sprints as well as issues that can be deleted from the backlog altogether
By tracking these KPIs, organisations can gain valuable insights into their penetration testing remediation performance and consistently work to identify improvement areas.
How do we create the report?
In line with the KPIs described above, we should structure the report into three sections. Using Confluence, we’ll create a new page and we’ll title the report Pentesting remediation performance report. We’ll make heavy use of Confluence’s layout tools to make sure that the report looks visually organised and that data is presented in a digestible format. We’ll also make use of JIRA filters and Confluence macros to integrate JIRA data within the report.
In the first paragraph we’ll provide a short introduction describing the purpose of the report and how the data presented can benefit the reader. In addition, we should provide a contact person (usually the CISO, since the report is aimed at upper management) in case readers necessitate additional clarifications or discussions regarding the contents of the report.
Average resolution time
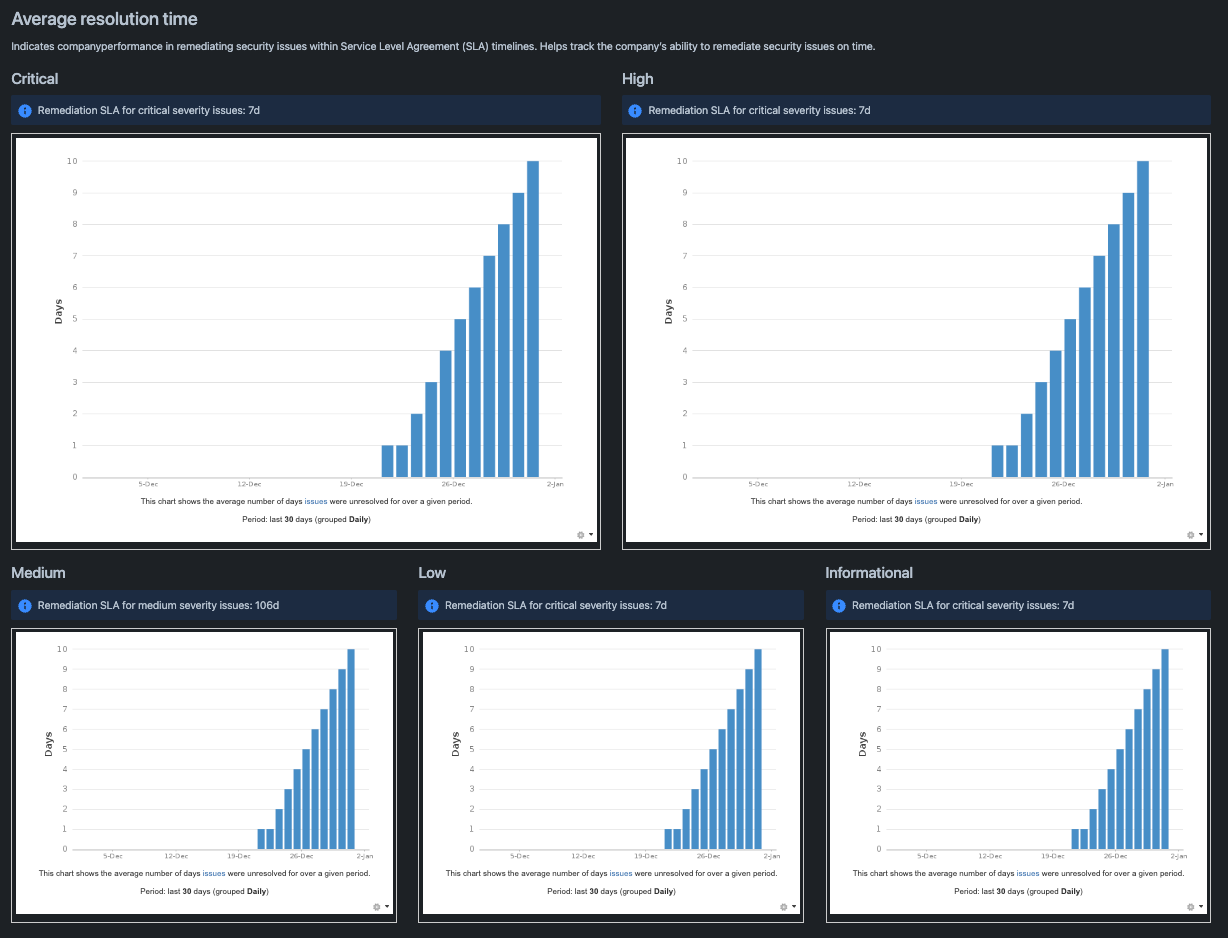
In the first part we will provide the most important performance KPIs: average resolution time of penetration testing findings, broken down by finding severity. These are fundamental to help track if security issues are being remediated on time. They can also assist the CISO with making a business case for additional resources if the company consistently fails to remediate pentest findings within SLA timelines.
To create the report we need to first provide an introductory statement explaining the objective behind this section and how it can help readers assess company performance. Then we’ll need to create charts to report the JIRA data broken down by severity. We’ll do this by using a JIRA macro called Average Age Chart to report the average resolution times. However, In order to fill each JIRA chart with data, we’ll need to configure specific JIRA filters for each.
Creating filters in JIRA allows you to easily access the data for specific subsets of issues. You can create filters based on various criteria, such as issue type, project, assignee, and status. To create a filter, go to the Issues page > Search for Issues page, then click on the Create filter button, and enter a name and filter criteria using JQL.
For this first part of the report you should create 5 filters, each dedicated to a specific severity level. The query template to use to create the individual filters is as follows:
project = [INSERT_PROJECT_NAME] AND issuetype = [INSERT_TICKET_TYPE] AND status in ("In Progress", "To Do") AND "Severity[Dropdown]" = [INSERT_SEVERITY] order by created DESCThe above query will return all open issues for the specific ticket type in the specified project and with the specific severity.
Note that the query above requires you to insert ticket type and severity name in line with your JIRA configuration. To learn how to set up JIRA in order for the report to work, head over to our article on processing pentest findings in JIRA and Confluence.
You should then create a filter for every severity level and store them under the name Open severity issues.
Once done you will be able to create the five JIRA charts for each severity level. Create the charts by using the Average Age Chart macro. This can be found by clicking the + symbol in the editing menu on the top of the page. To find the chart use the search box that appears at the top of the widget.
For the first two charts (that report critical and high severity issues) add a two column layout by clicking on the layout button at the top of the page. Once done, insert the chart and configure each as follows:
- On top of each chart add a title (you can use the severity rating as a title, for example) and a small info box (added in the same way as the average age chart, but by searching Info Panel instead of Average Age Chart) outlining what the remediation SLA is for that specific ticket severity.
- For each chart, insert the specific JIRA macro and configure the below parameters:
- Width: auto
- Border: box ticket
- Author: specify your name or leave Atlassian
- Filter: select the relevant filter by searching it by its title
- Period: select daily
- Days previously: select the lookback period you prefer, although 180 days is suggested, as a minimum
- Refresh interval: every 15 minutes
Once done, repeat the same process for all other charts. Note that in the second row you should use a three row column layout.
Ticket remediation performance
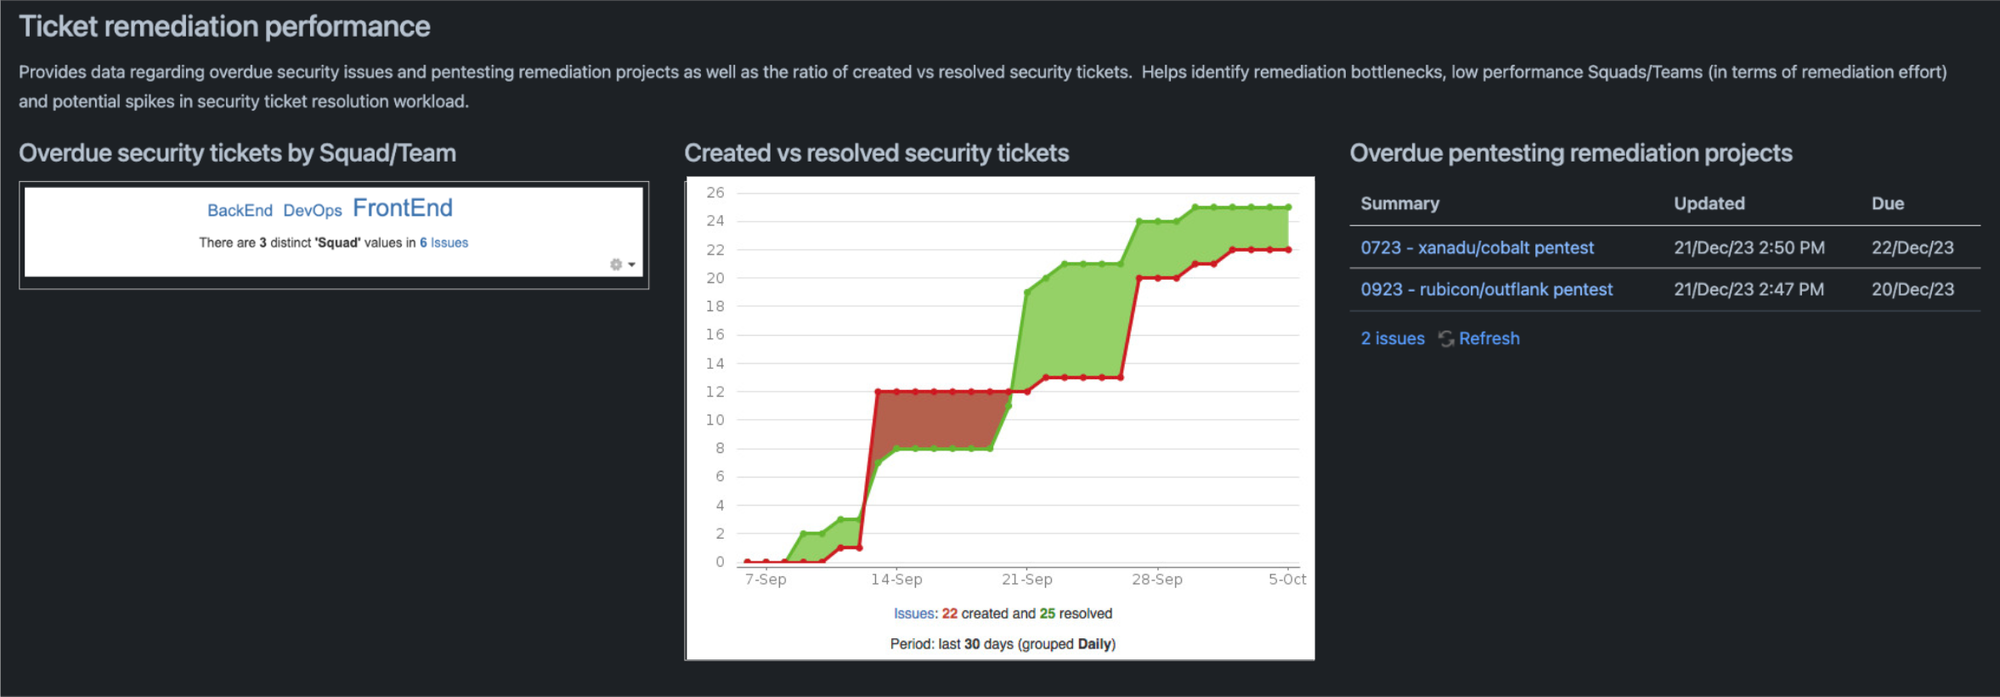
The second section provides another set of useful performance indicators. Here we leverage simple KPIs reporting on overdue security issues by Squad/Team, delayed pentesting remediation projects and the ratio of created vs resolved security tickets. This data helps identify bottlenecks, Squads/Teams that are affected by low remediation performance as well as potential spikes in resolution workloads.
This section will contain three distinct charts each presenting its own KPI. To build this section, add an introductory paragraph explaining the section’s objective and how it helps the readers. Then add a three-column layout and include the below charts:
Heat map chart
This chart will report the distribution of overdue issues by Squads/Teams. To build this chart create a JIRA filter using the below JQL query:
project = [INSERT_PROJECT_NAME] AND issuetype = [INSERT_TICKET_TYPE] AND status in ("In Progress", "To Do") AND due <= "0" order by created DESCSave it and call it All overdue issues. Then insert a heading called Overdue security tickets by Squad/Team and add a Heat map macro directly below. In the macro, configure the below parameters:
- Width: auto
- Border: box ticket
- Author: specify your name or leave Atlassian
- Filter: select the relevant filter by searching it by its title
- Statistic type: Squad (assuming you have configured security tickets like this) or Team
- Period: select daily
- Refresh interval: every 15 minutes
Created vs resolved security tickets
This chart will report existing or developing performance bottlenecks within current remediation workloads. Within this chart the goal is to measure, on a daily basis, the number of security issues created versus those that are resolved. If you are consistently generating more security tickets than you can close, your team may have a capacity problem.
Additionally, the chart may help your team identify sudden spikes in workload. If there is a sudden surge of created tickets overtaking the resolved ones, it may indicate an impending spike in your team’s workload. Ideally the two lines should settle into a consistent pattern where for every batch of created tickets there is also a constant volume of tickets being closed.
To build the chart create the filter project = [INSERT_PROJECT_NAME] AND issuetype = [INSERT_TICKET_TYPE] order by created DESC and save the filter with the name All security issues.
Then insert a heading called Created vs resolved security tickets and then a Created vs. Resolved Chart macro. Configure the below parameters:
- Width: auto
- Border: box ticket
- Author: specify your name or leave Atlassian
- Filter: select the relevant filter by searching it by its title
- Period: select daily
- Days previously: 180
- Cumulative totals: No
- Display the trend of unresolved: No
Overdue pentesting remediation projects
This chart will highlight any overdue security remediation projects. The goal is to spot projects that are past their due date. This way, your team may know when a deepdive is needed to assess any systemic issues or impediments preventing completion.
While the first Heat map chart will help surface individual teams that are impeding remediation efforts, this chart will help surface systemic cross team issues. Note that this chart tracks the due dates of epics that are assigned to individual security tickets. Again, you should read this article to learn how to configure JIRA epics to track pentest remediation efforts.
To create the chart insert a heading called Overdue pentesting remediation projects and add a Jira legacy chart macro to the report. Then create the below filter:
project = [INSERT_PROJECT_NAME] AND issuetype = Epic AND status in ("In Progress", "To Do") AND due <= "0" order by created DESCPaste the above filter in the macro search box to retrieve the data. Then, configure the below parameters:
- Display as: Table
- Maximum issues: 5
- Columns to display: Summary, update and due date
Top 10 oldest security issues
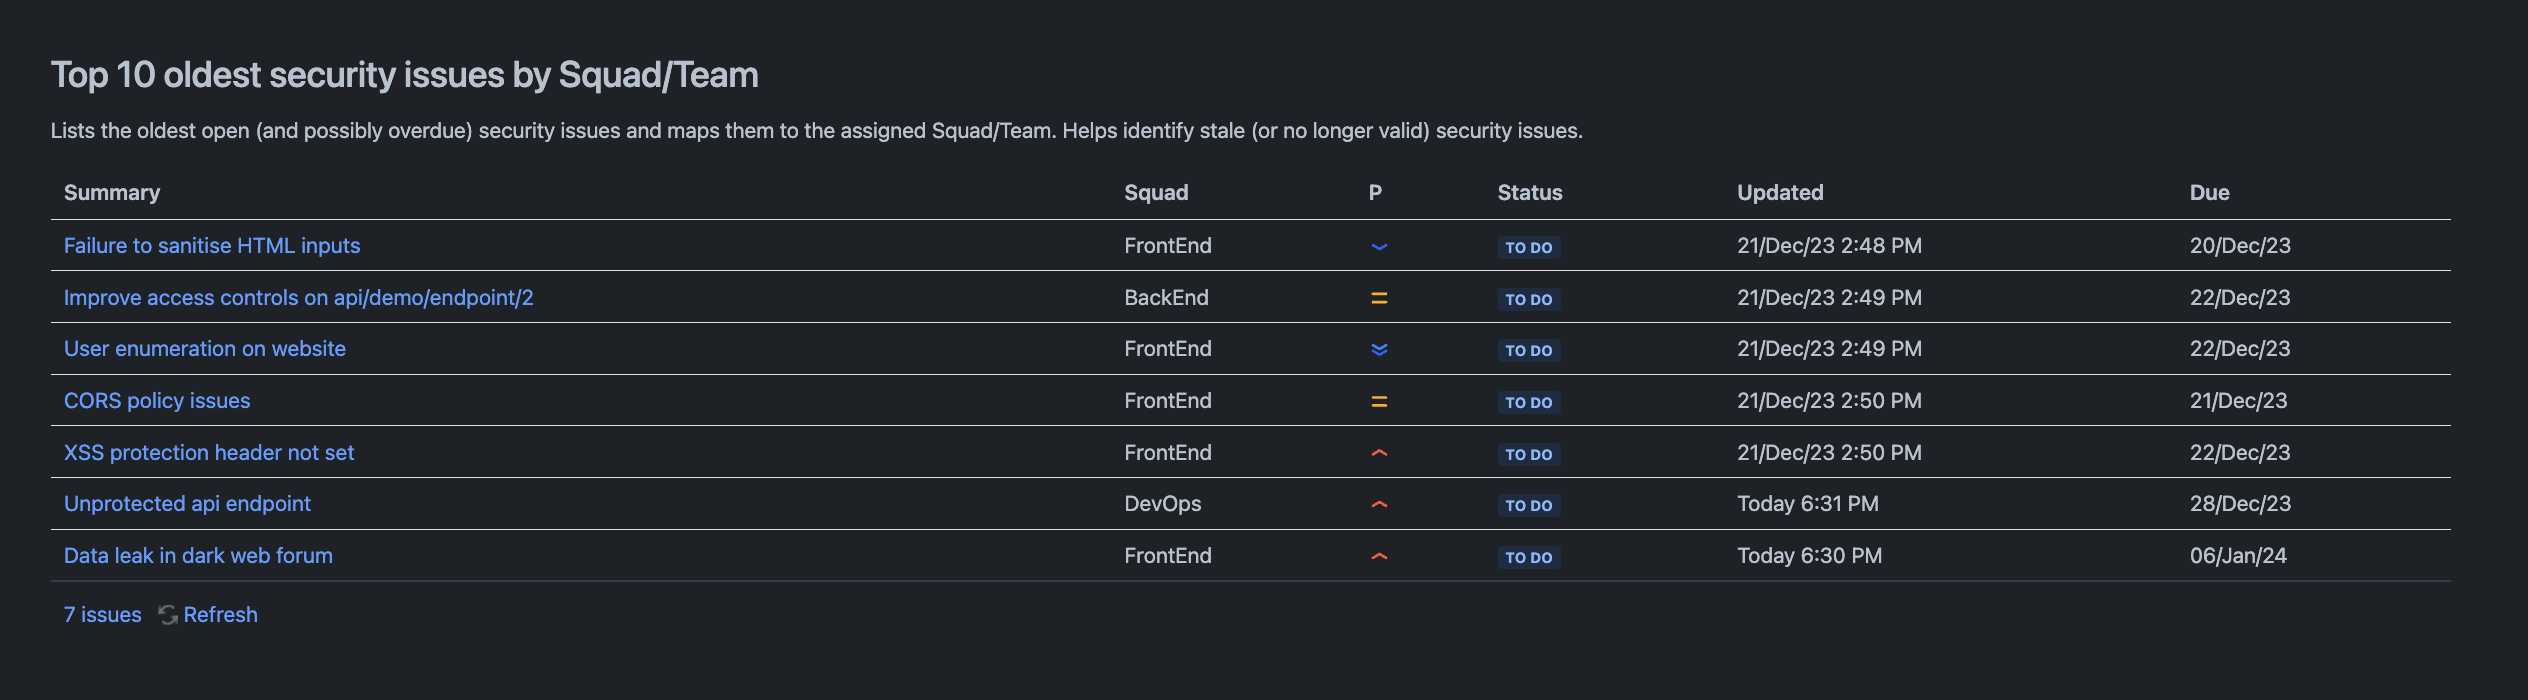
This final section will help consistently spot issues that are going stale or that are at risk of being forgotten. By monitoring the oldest security issues, your team can work with development teams to ensure specific sprints are organised to clean up such tickets. Additionally, this KPI will help consistently identify redundant or invalid security issues. Once identified, you’ll be able to either close them or accept the underlying security issues in your risk register.
To create the chart insert a heading called Top 10 oldest security issues by Squad/Team. Provide an explanatory paragraph outlining the objective behind the KPI. Finally, insert a Legacy JIRA chart macro.
Use the same filter that you created for the Overdue security tickets by Squad/Team chart and paste it in the search box to retrieve the data. Finally, configure the below parameters:
- Display as: Table
- Maximum issues: 5
- Columns to display: Summary, Squad (Team), Priority, Status, Updated and Due Date
Save the chart to complete your report. It’ll now start ingesting JIRA data automatically and can be immediately shared throughout the organisation.
Conclusion
These intuitive, impactful KPIs wrapped in a simple, easy to digest format should help your team immediately improve the reporting of remediation performance. By adopting this reporting strategy, you and your team should be able to materialise the following improvements:
- Increased transparency and accountability: By communicating the organisation’s progress in remediating vulnerabilities, you’ll demonstrate transparency and accountability. This will allow upper management to gain actionable insights into security remediation efforts and rapidly identify areas for improvement. As a result, trust and cooperation between your team and other departments will improve as alignment over company security objectives (hopefully) increases over time.
- Enabling informed decision-making: By providing upper management with accurate trends, you’ll give them the necessary information to make informed decisions about resource allocation. As a result, they’ll help you prioritise security initiatives in a more effective and efficient manner. By understanding the organisation’s vulnerability landscape and remediation challenges, they will make strategic choices that enhance the company’s overall security posture. Moreover, it’ll help develop an approach that seeks to align security investments with business goals using data-driven insights.
- Demonstrating security commitment: By pushing the organisation to consistently remediate vulnerabilities within defined timelines, your team can showcase their commitment to influencing the organisation, driving improvement and safeguarding its reputation. This proactivity should demonstrate, over the long term, your team’s ability to drive security awareness and improvements throughout the company. Regular and effective reporting will strengthen your team’s credibility and ultimately ensure that their work is recognized and appreciated.
Finally, once you are satisfied with your Confluence pentest reporting system, you can further streamline the analysis and upload of pentest reports by using AI-based solutions.