How to process pentest findings with Jira and Confluence
Keeping on top of pentest findings is challenging. Find out how to process your pentests in an automated, auditable and asynchronous manner by using Jira and Confluence

If your company runs regular penetration tests then you’ll understand the challenges of processing pentest findings effectively and efficiently. To address such challenges, security teams typically turn towards Penetration-Testing-as-a-Service (PTaaS) platforms in order to fulfil their reporting and processing requirements. Unfortunately, PTaaS platforms are expensive; requiring time-consuming contract negotiations and on-boarding.
Fortunately, Atlassian products such as Jira and Confluence can offer a robust alternative. With some clever configuration, both solutions can provide a sustainable pentest processing solution for lean security teams under time and cost pressures.
Requirements for effective pentest tracking
There are countless ways to structure a pentesting processing solution. However, at a minimum, the essential requirements for effectively processing findings are:
- Tracking: each individual finding must be tracked through a ticket and tied back to its report
- Triaging: findings must be automatically prioritised and allocated to the relevant teams
- Reporting: remediation progress must be inspectable within an overall reporting dashboard
All three requirements, combined, ensure that findings are effectively captured, allocated and transparently tracked throughout their lifecycle.
Tracking findings with Jira
Configuring security issues
Jira is a popular issue tracking product developed by Atlassian that allows bug tracking and agile project management. If your organisation uses Jira you have two options:
- You can setup a specific Jira project for the processing of pentests
- You can coordinate with the IT team to configure specific issue types within existing Jira projects
Either way, what matters is having a project in Jira and the ability to configure issue types. To configure issue types, navigate to the left toolbar and within it click on Project settings, then Issue types and finally Add issue type. A modal box will appear, add a meaningful Name and Description, to let people know when to use the issue you are creating. Make sure to configure a suitable icon.
At a minimum, the fields to include in the issue are:
- Summary: this field is the issue title. It is mandatory and cannot be removed
- Description: provides information such as steps to reproduce the finding, impact and remediation recommendations
- Priority: used to understand the remediation priority of the finding
- Severity: used to understand the severity of the finding and assist with prioritisation
- Assignee: pins the issue to a colleague responsible for remediation
- Labels: used to label the issue in order to generate reporting metrics
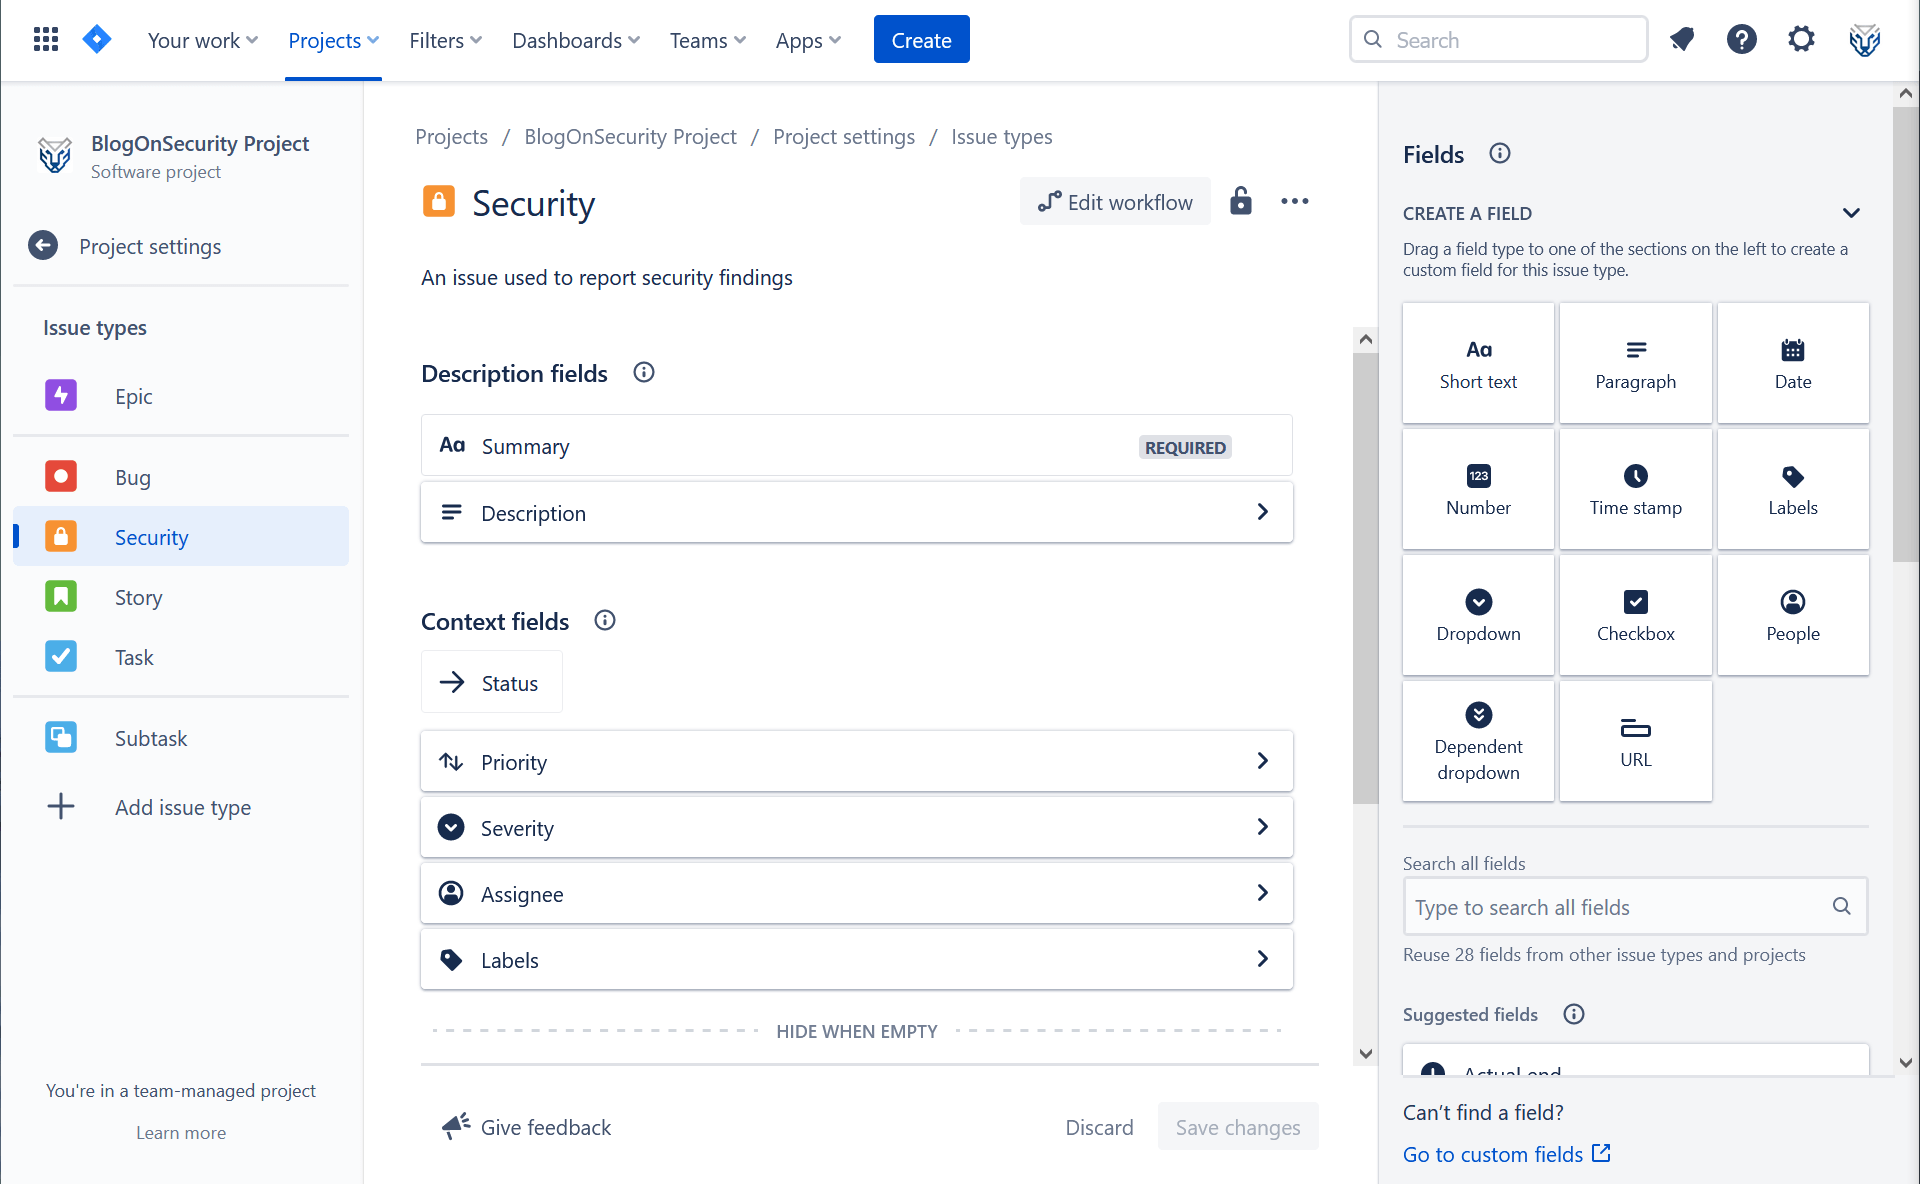
Configuring the fields for your security issue should be easy. The Summary, Description, Assignee and Labels fields should all be available within the issue upon creation. However, you will have to search the Priority field within the right-hand side menu and drag it into the issue configuration.
The Severity field requires a couple of extra steps: on the create a field widget (on the top right of the page) you should select the Dropdown field, add Severity as a field name and click on the add option button to add all the necessary severity levels you want to track in the issue. Atlassian recommends defining, at a minimum, four severity levels mapped to CVSS v3: Critical, High, Medium and Low.
Once done hit the Save changes button. Your new issue should look something like the picture below:
With your security issue freshly configured, you can now use the assignee field to assign the security issue to the relevant colleague for verification and remediation.
Tracking security issues
To effectively track pentesting findings it is not enough to use our custom-defined issue. We need an overarching, master ticket to track all findings belonging to a pentest engagement. This is where Jira Epics come into play. In the software development world, Epics are used to track all issues belonging to a specific development workstream.
As you can imagine, they become useful to group together all findings from a specific pentest. You can create epics in Jira by pressing the large Create button at the top of the page and selecting Epic as the Issue type.
Make sure to name your pentesting epics in a consistent manner. Using a consistent naming convention will spare you pain down the line, especially when it comes to developing automations that rely on epic names (more on that later…). A sensible naming convention could look something like this
[MONTH+YEAR] - [ASSESSMENT_PROJECT_NAME]/[ASSESSMENT_PROVIDER] pentest
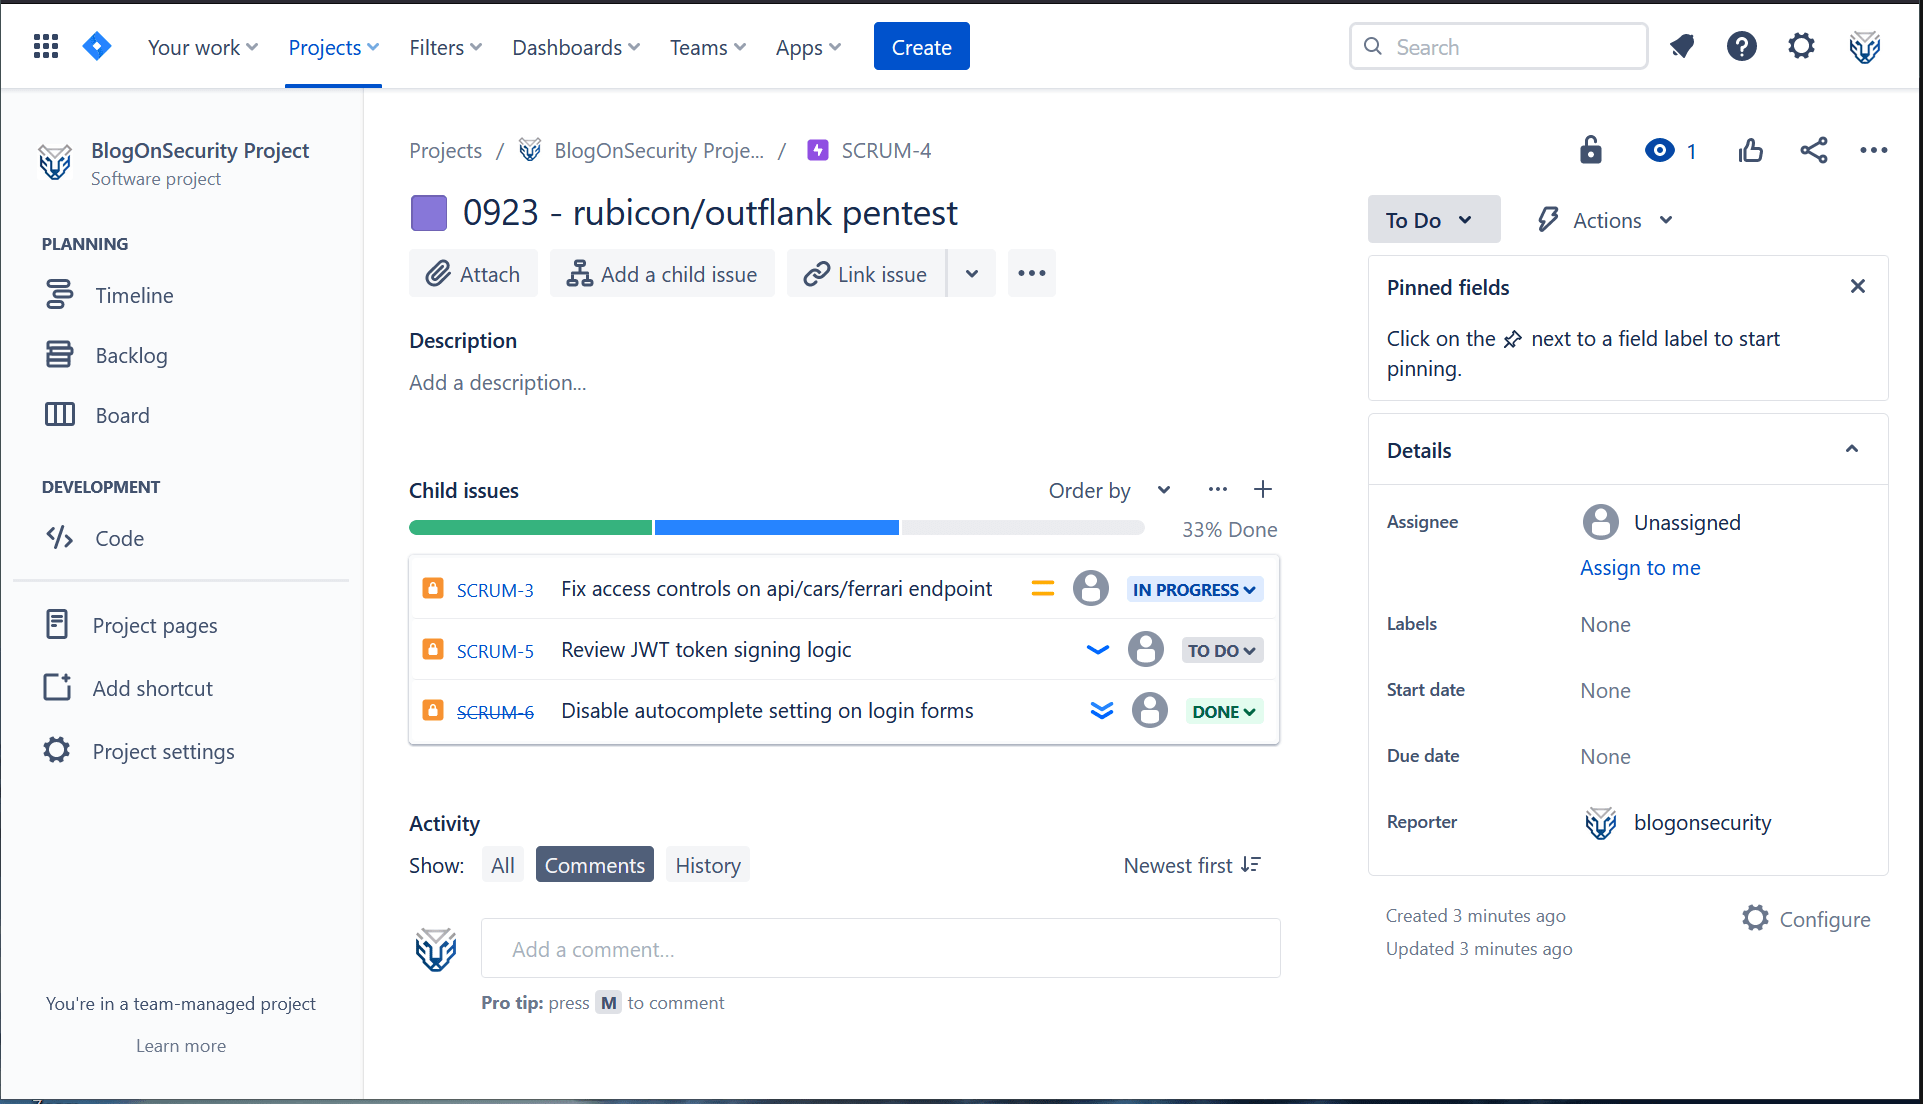
Example: 0923 - rubicon/outflank pentest
With the pentest epic defined, you can now begin aggregating the individual security issues by assigning them to the epic. To link the epics to your security issues, simply click on the Add epic button at the top of each issue’s overview panel. A dropdown will appear, search for the relevant epic and click on the name to assign it.
Once you have assigned the epic to all your security issues, you will be able to:
- Check how many security tickets belong under the pentesting project
- Check, at a glance, the remediation status of all tickets under the pentest report
- Assign epics to specific colleagues to define who is responsible for remediation
The below picture gives a sense of the status overview that epics provide:
Automatically triaging findings with Jira
Effective triaging of security issues in Jira is not achieved simply by assigning a ticket to someone. Effective triaging requires, at a minimum:
- Having clear metrics for verifying and remediating findings
- Ensuring that ticket priority always corresponds to the severity
- Assigning findings to the responsible teams for verification and remediation
The first bullet point opens an interesting thread on defining useful metrics for the processing of pentest findings. While interesting, this is a huge topic deserving of its own blog post. For the purposes of this article, we’ll consider the topic out of scope
To address the remaining bullet points, Jira automation comes to our rescue. In order to effectively scale the processing of findings over time, a lean security team must consistently automate repetitive tasks. Repetitive activities such as assigning priority levels or teams to issues constitute perfect candidates for automation.
The Jira automation configurator is accessed by navigating to the left menu, clicking on Project settings and then on Automation. Rules can be created by clicking on the Create rule button on the top-right of the page. A drag and drop configurator is used to build automation rules and is very easy to use.
Jira automations are based on the concept of actions which, once chained together, bring automations to life. Actions in Jira automation are grouped into three categories:
- Triggers (green): start the execution of an automation rule. They can listen for events or be scheduled to run
- Conditions (yellow): they limit the scope of automation rules to specific user groups of keywords. They can also make your rules run a specific automation path, depending on which conditions are met
- Iteration branches (purple): they iteratively apply automated actions and conditions against specific tasks or tickets
- Actions (blue): they execute updates or actions against tickets when all triggers, conditions and iteration branches successfully execute
To achieve our requirements we need, at a minimum, to develop two automations:
- Assigning priorities to findings based on severity
- Assigning team leads for verification and remediation of security findings
Automating priority assignment
The goal of this automation is to ensure that the priority of our security tickets always matches the severity level. Why - you may ask - would we want that? Because security tickets should always be prioritised in line with the severity level of the reported finding. This reduces ambiguity in the processing, especially if the security team has defined processing metrics to impose on ticket assignees.
For example, we could define some processing metrics based on a two stage approach:
- Verification stage: ticket is assigned to a team who verifies whether the finding should be addressed or not (i.e. the inherent risk within the finding can be accepted by the business)
- Resolution stage: ticket is assigned to a team who is accountable for remediating the finding within stated timelines
Based on this set-up, the security team could define the below processing metrics:
| Severity level | Verification time frame | Resolution time frame |
|---|---|---|
| Critical | 1 day | 1 week |
| High | 1 week | 2 weeks |
| Medium | 2 weeks | 4 weeks |
| Low | 4 weeks | 4 weeks |
| Informational | 5 weeks | 5 weeks |
The above metrics are a suggestion for argument’s sake. A lean security team should co-define metrics in collaboration with the business and fine-tune accordingly. Regardless, armed with these basic metrics we can now develop our priority assignment automation.
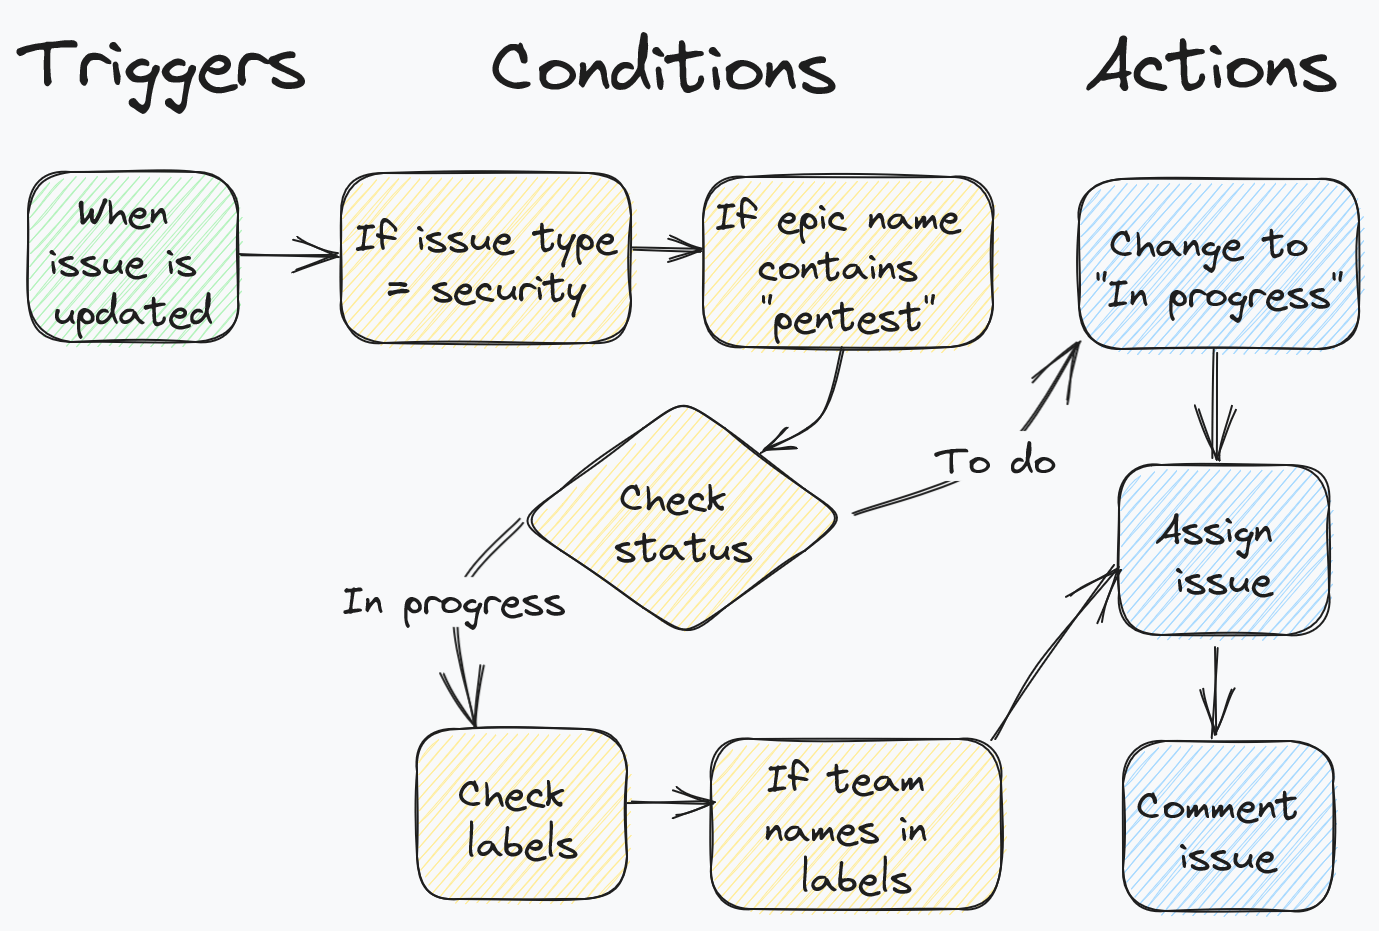
Our automation, at a high-level, should flow like this:
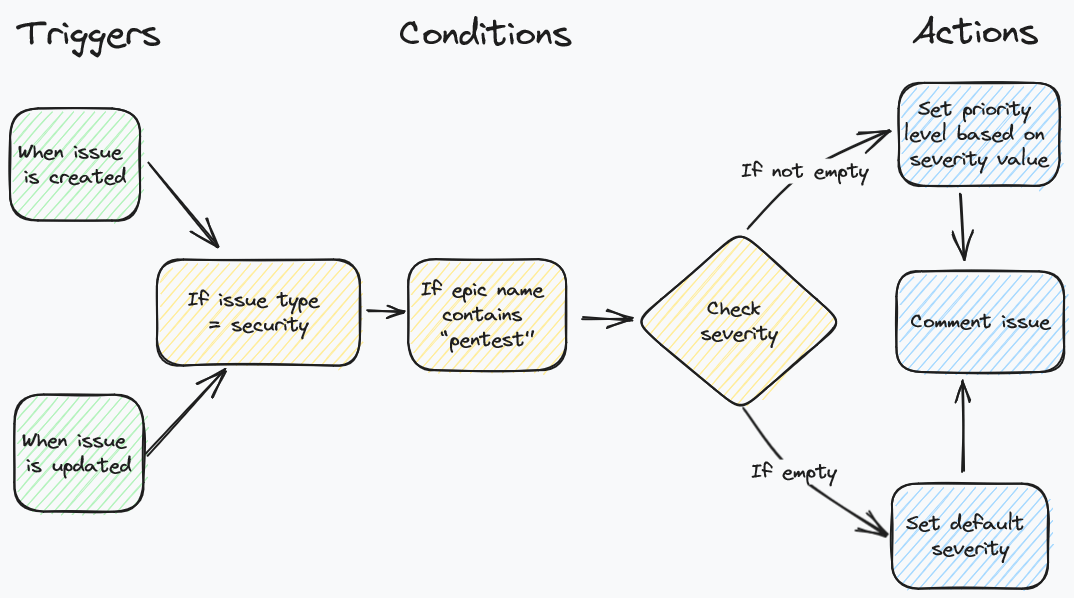
Note the presence of two triggers (green boxes): this implies that we should have two distinct automations to fulfil both trigger conditions. Basically we want to auto-assign priority levels regardless of whether the ticket was updated (because someone decides to downgrade the severity level) or created for the first time in Jira (say, by another automated mechanism).
Let’s start by creating the automation rule to cater for situations where security issues are being updated by users (or other automations).
The automation steps are configured as follows:
- Start by first defining a trigger based on the Issue updated type
- Add an Issue fields condition, set Field to
Issue Type, Condition toequalsand Value toSecurity - Add a Related issues condition. Set Related issues to
Epic, Condition toMatches specified JQLand addsummary ~ "pentest"in the Matching JQL field - Add an IF, ELSE block condition. Select the
At least one condition matchesoption. Click on Add conditions and pick the Issue fields condition. Set Field toSeverity, Condition toequalsand Value toCritical - Within the underlying branch, select the Edit issue fields action. In the Choose fields to set dropdown select Priority. Then set the priority value to
Highest. - Still within the underlying branch, select the Add comment action and insert a comment to tell users that the priority of the ticket was automatically set according to the severity level
- Repeat steps 4, 5 and 6 for each severity level, mapping them to every equivalent priority level
- At the end of the flow, click on the Add else option to create a final step to catch tickets where the severity level has not been defined. Within the underlying branch, create an Edit issue action to set both Priority and Severity levels to a default value.
- Once done, add a meaningful title to your automation and click on the Publish changes button

Want to build this automation quickly? Go Premium to have unlimited access to all of Blog on Security's tools, cheatsheets and automation code. Click on the button below to purchase a Premium subscription. Once subscribed, you’ll then be able to download the code for both automations described in this article which you can then import into Jira . Easy!
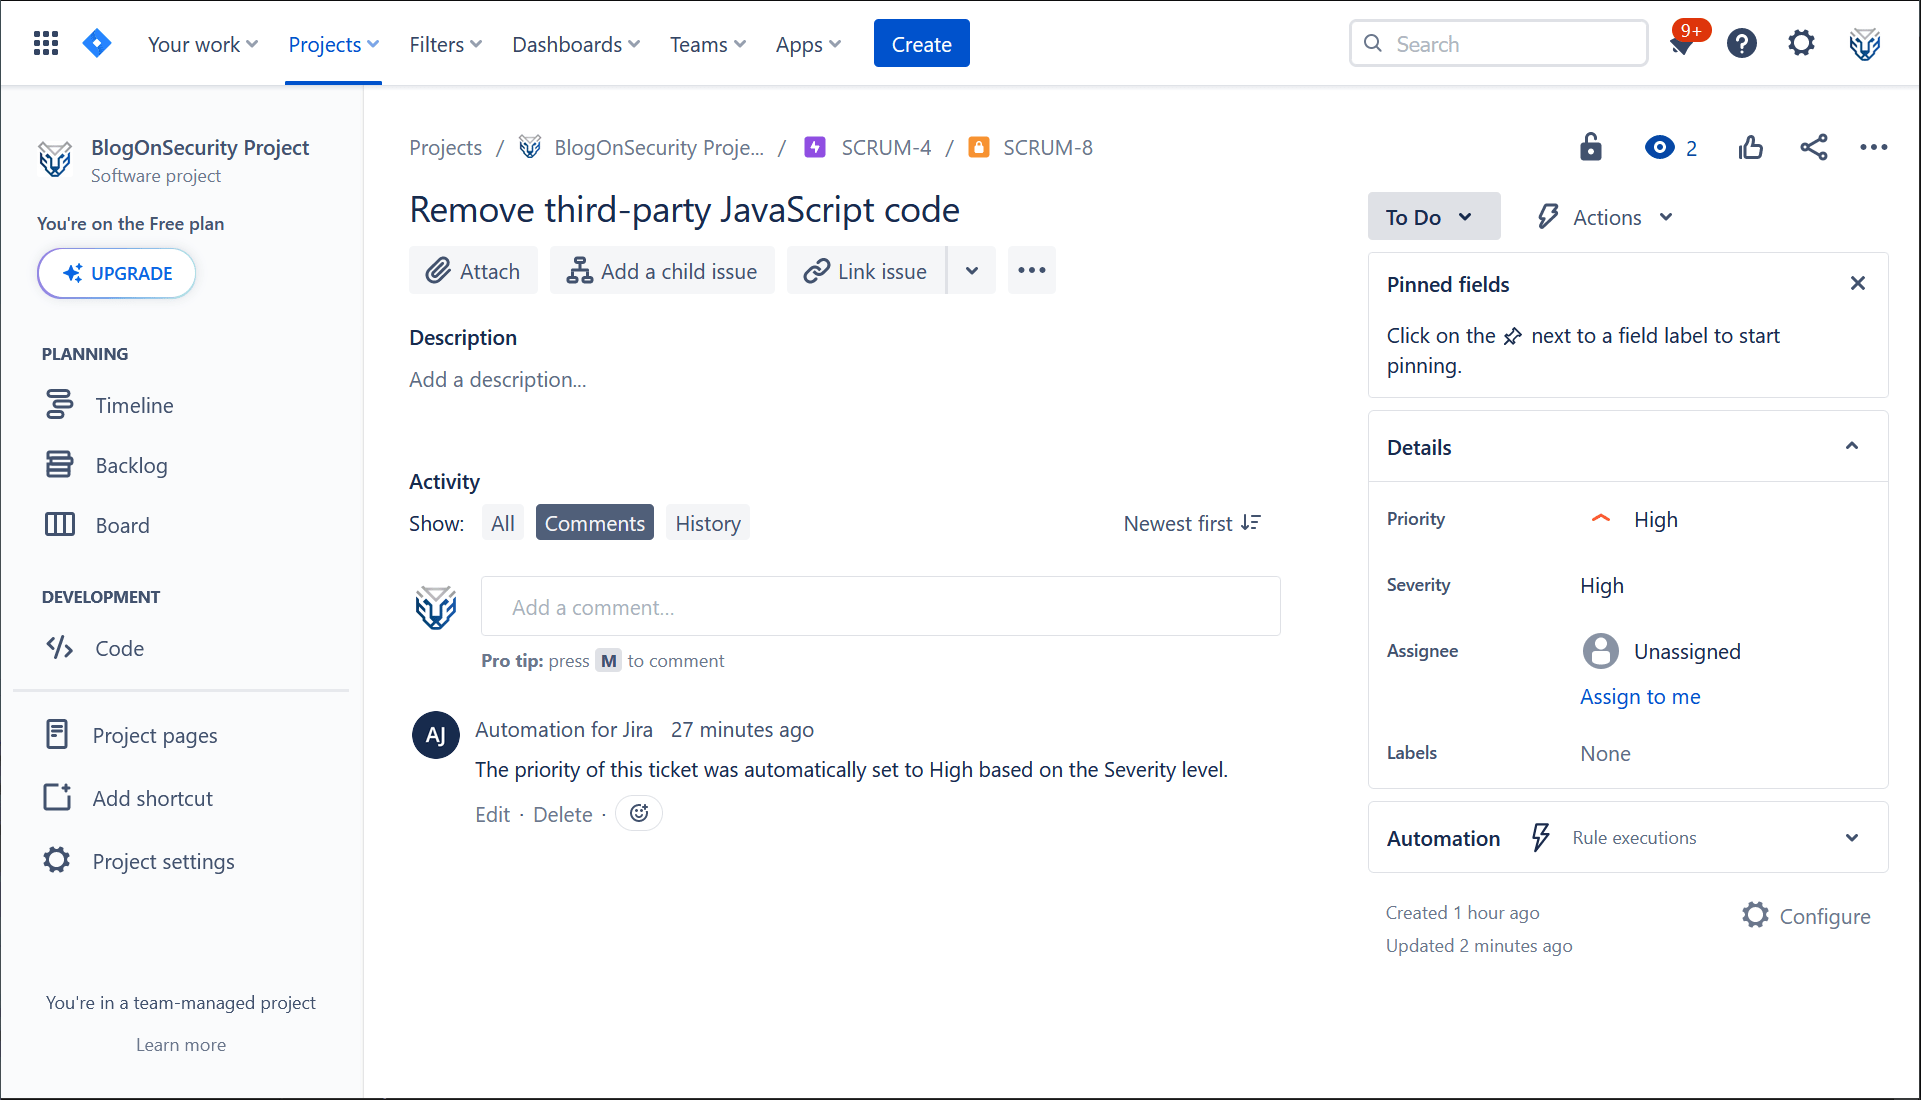
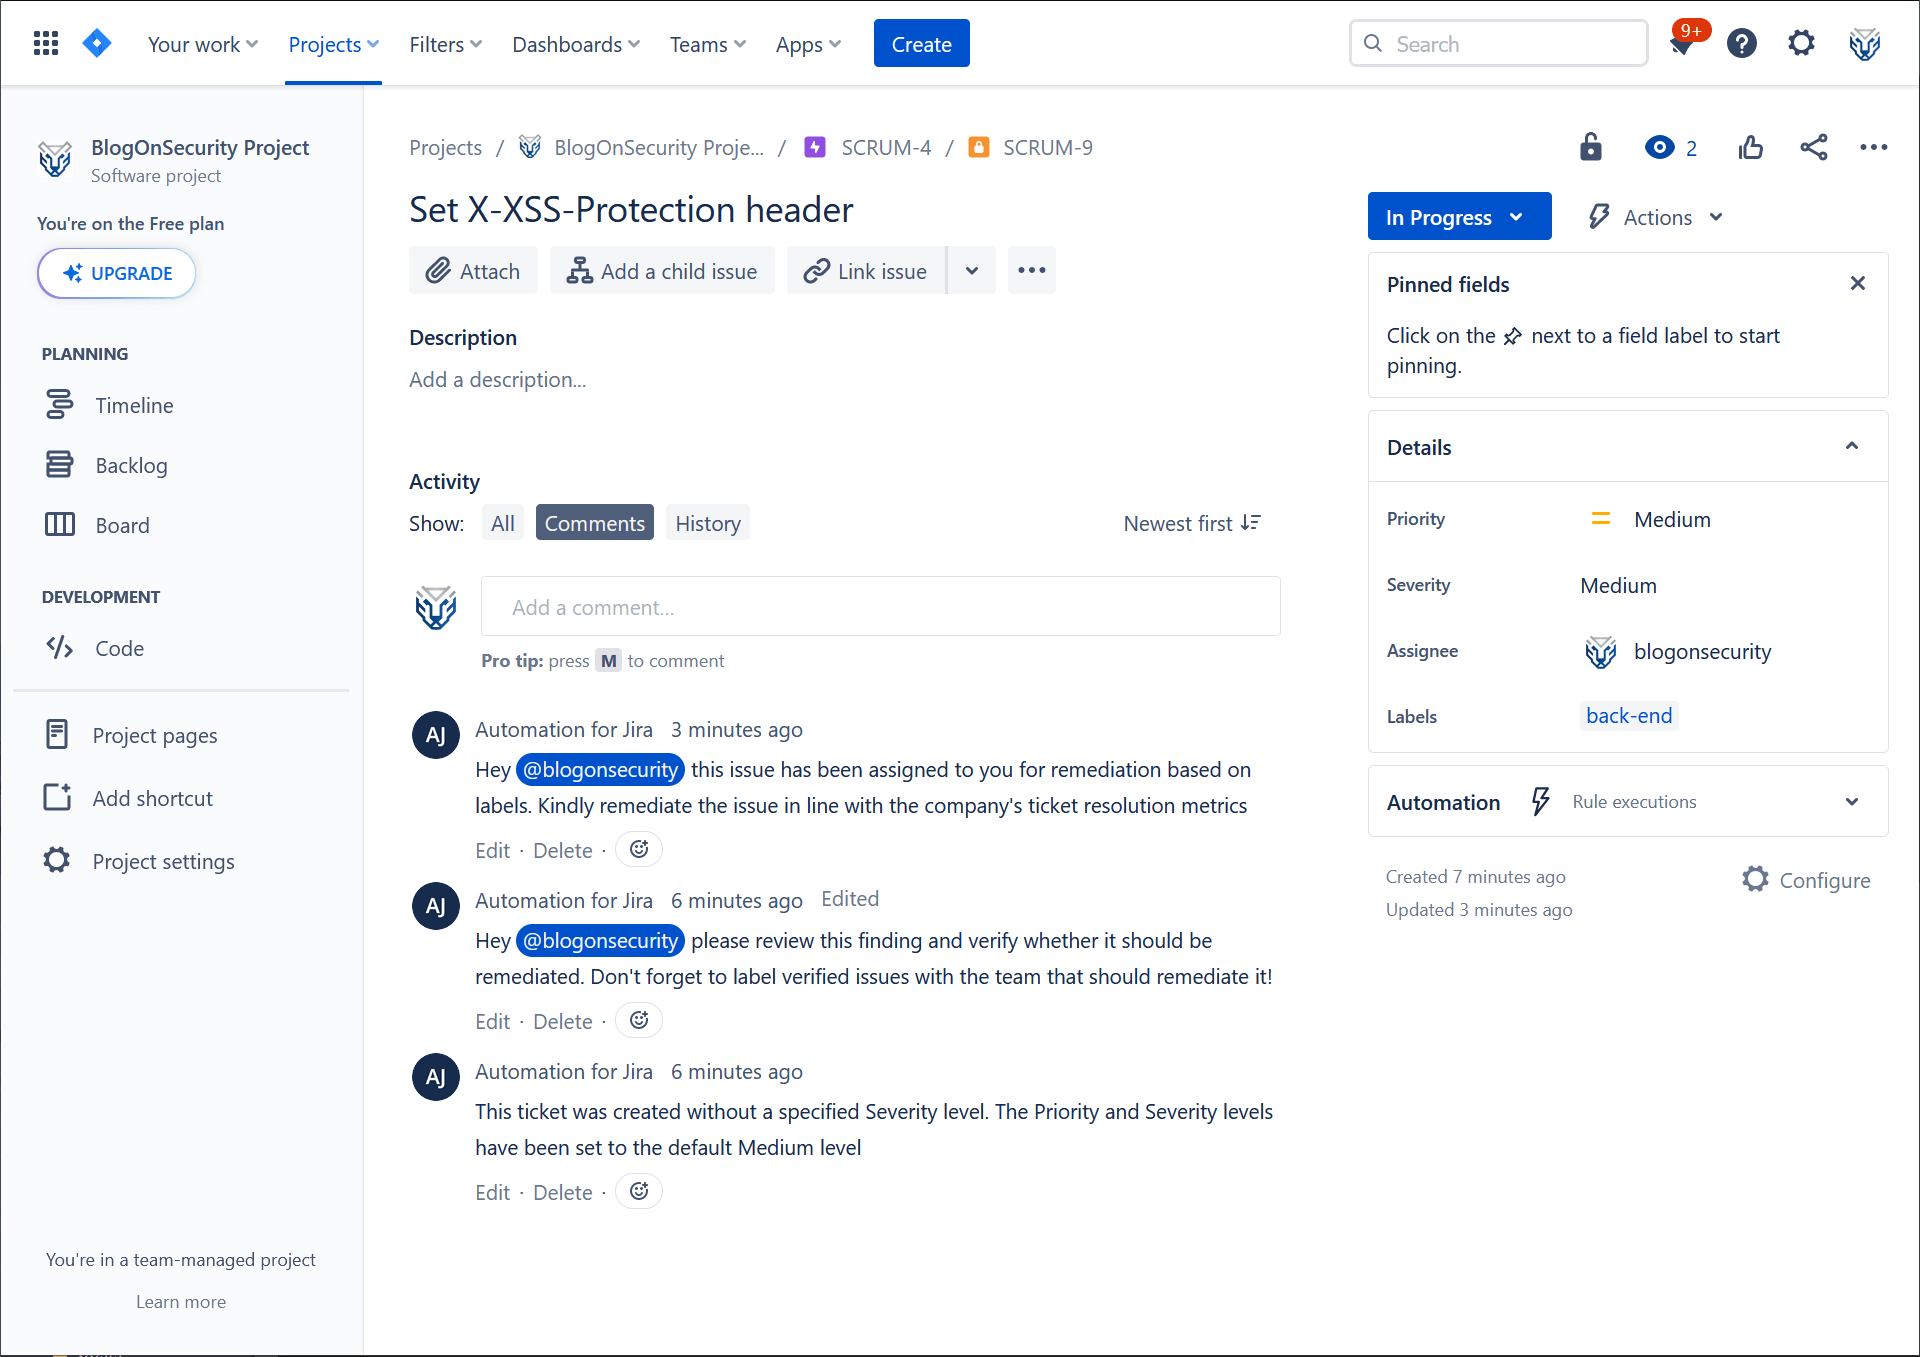
With this automation configured, every time a user makes an update to a security ticket, Jira will automatically keep the priority level synced with the severity of the finding. See the comments section in the screenshot below for an example of the automation in action:
To create an equivalent automation for security tickets being created, simply copy your newly developed automation. To do so, go to the automation home page, go to the row listing your automation, click on the three dots at the right of the page and select Copy. Change the name of your automation rule and then change the trigger from type Issue updated to type Issue created. Click on Publish copy and - just like that - you’ll have an identical automation applied to all new security tickets being created in your Jira project.
Automating findings assignment
The goal of this automation is to ensure that tickets are automatically assigned to the relevant teams for both verification and remediation. The simplest automation should listen for ticket updates and assign for verification all tickets with a To do status.
Once tickets are verified, reviewers can label tickets with the name of the team that needs to remediate the finding. The automation can then read such labels and assign the ticket to the relevant group for remediation.
Given the above, our automation should flow like this:
For this automation to work you must define the necessary user groups needed to verify and remediate pentesting tickets. For example, you could have one group called pentest-verification-team and various remediation groups, such as frontend-team or backend-team, to assign verified tickets for remediation.
Creating groups in Jira is simple: click on the settings gear at the top-right of the page - it’s on the menu toolbar, near your user icon. Click on User management and then Groups. Click on the large, blue Create group button to begin configuring the needed verification and remediation groups.
The automation steps are configured as follows:
- Repeat steps 1, 2 and 3 of the priority assignment automation discussed in the section before
- Add an IF, ELSE block condition. Select the
At least one condition matchesoption. Click on Add conditions and pick the Issue fields condition. Set Field toStatus, Condition toequalsand Value toTO DO - Within the underlying branch, select the Assign issue action. In the Assign the issue to dropdown select
User in a group. Then set the Method to choose assignee toBalanced workload. Finally, in the Group field, type and select the group you have defined to verify pentest findings. - Still within the underlying branch, select the Transition issue action. Set Destination status to
IN PROGRESS - Again within the underlying branch, select the Add comment action and insert a comment to tell users that the ticket was automatically assigned to the pentest verification team
- Back on the main branch, add another IF, ELSE block condition. This time, select the
All conditions matchoption. Click on Add conditions and pick the Issue fields condition. Set Field toStatus, Condition toequalsand Value toIN PROGRESS. Once more, click on Add conditions and pick the Issue fields condition. Set Field toLabels, Condition toequalsand Value to your desired label to identify the remediation team. For example, you could use the labelfront-endto assign tickets to your company’s front-end dev team - Repeat step 5, ensuring that in the Group field you insert the relevant group mapped to the specified label. Also repeat step 7 again to ensure the automation provides a relevant update comment to the ticket
- Repeat steps 8 and 9 for every company department which supports the security team with remediating findings. Once done, add a meaningful title to your automation and click on the Publish changes button
Note: when commenting issues you can tag users assigned to tickets so that they are notified via email of the assignment. To tag users insert [~accountid:{{assignee.accountId}}] within the comment and Jira will take care of the rest. Nifty!
Want to build this automation quickly? Go Premium to have unlimited access to all of Blog on Security's tools, cheatsheets and automation code. Click on the button below to purchase a Premium subscription. Once subscribed, you’ll then be able to download the code for both automations described in this article which you can then import into Jira . Easy!
With this automation configured, every time a user makes an update to a security ticket, Jira will automatically review your findings and, based on status and labels, assign them for processing. Again, the comments section in the screenshot below showcases the automation in action:
Reporting remediation progress
Reporting is key to keep the business updated on pentest remediation efforts. For this, you can use Confluence, Jira’s wiki solution, to develop a basic, yet solid, reporting solution.
In order to provide meaningful information our report must include, at a minimum, the following sections:
- An overview of all open remediation work streams
- An overview of all penetration testing assessments performed by the company. This section should include information about assessment dates, testing providers, assessment scopes etc.
Considering the above requirements, our report would be structured in two sections:
- The first section, called open assessment remediation projects would list, in descending order, all remediation work streams that are in progress. Within this section, management could review the due dates of the individual work streams and track which ones are overdue.
- The second section, called penetration testing assessments would provide detailed information regarding the individual pentest engagements.
This report would be fully automated, relying on the underlying Jira data in order to produce up-to-date statistics. Additionally, the report could help additional teams (not just management) within your company. For example, sales or customer success managers could use the report to update customers or auditors.
To create this report we must first create the Jira filters to produce the necessary statistics and, secondly, build the actual report.
Creating filters in Jira
Creating filters in Jira is quick and easy. Navigate to the top menu toolbar and click on Filters, then on View all issues. Filters can be created using the drop-down menus defined at the top of the page. For the purposes of this tutorial, click on the Switch to JQL button on the top right of the filter menu, near the large Search button.
Filters are specified in Jira Query Language, abbreviated as JQL. To create the filters needed for this tutorial, copy the below JQL statements in the search bar and click Save as at the top of the page to store them for later use:
- Query to view all ongoing pentest epics:
project = "YOUR_PROJECT_NAME"
AND issuetype = Epic
AND summary ~ "pentest"
AND status != Done
ORDER BY duedate DESC- Query to list all issues belonging to a single pentest assessment. You should create one for each pentesting epic (or for as many as you want to include in your report):
project = "YOUR_PROJECT_NAME"
AND issuetype = Security
AND parent = "ID_OF_RELEVANT_EPIC"
ORDER BY created DESC
Creating the report in Jira
To create the report, we’ll be using a combination of markdown and Jira macros. Jira macros are a powerful feature of Confluence which allows you to import Jira data into your report and summarise it in various visual formats.
To create the report, open your Confluence project and click on the large Create button at the top of the screen. Add your report title (something like, pentesting remediation progress report could do), a short paragraph to describe the purpose of the report and the headings for both sections of the report.
In our first section of the report, under the open assessment remediation projects heading, we’ll be using the Filter Results macro to display a list of all ongoing remediation work streams. To create the reporting table, click on the + symbol on the toolbar at the top of the page (the one near your profile icon). Type and select the Filter Results macro and complete all the sections in line with the below screenshot:
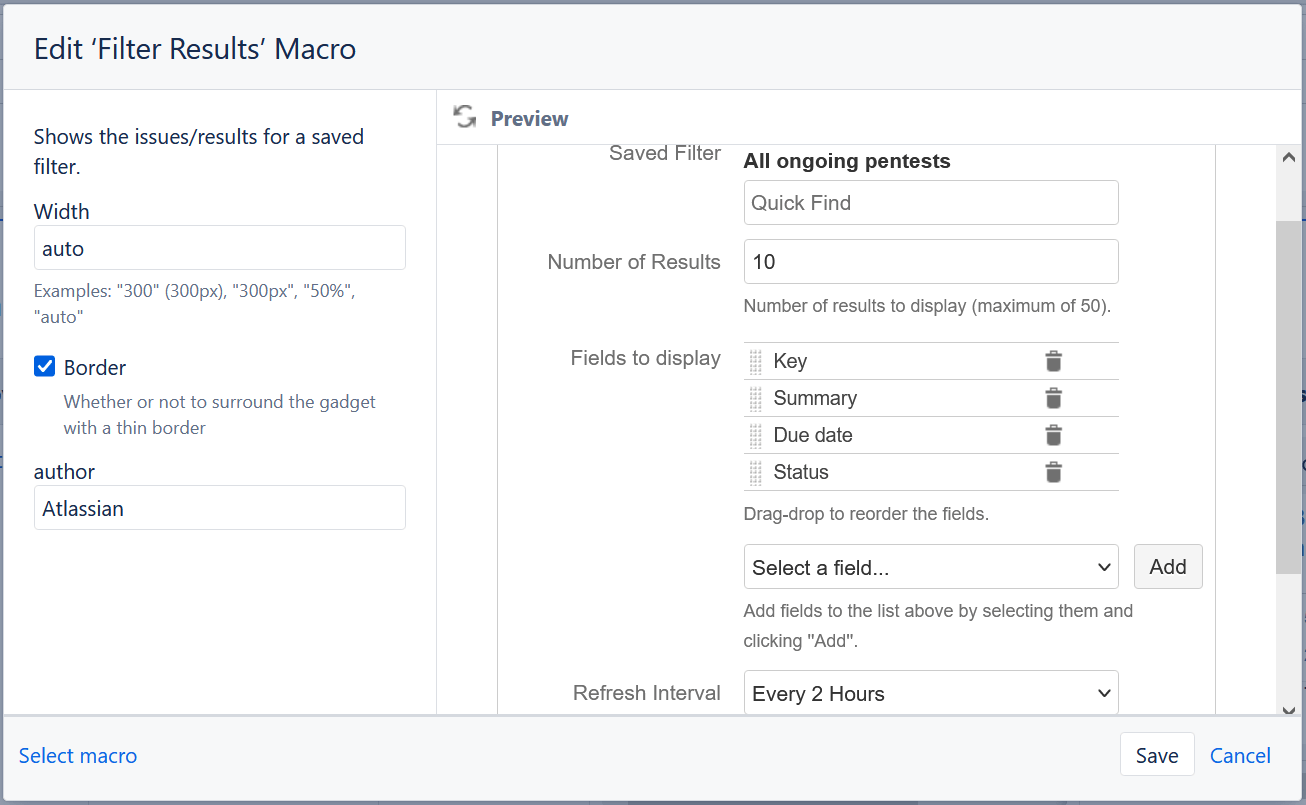
Within the Saved Filter field make sure to specify the filter you created in order to view all ongoing pentest epics. Additionally, ensure that the Key, Summary, Due date and Status fields are configured to be displayed by the macro. These can be configured by using the field search box and clicking on the Add button. Always make sure to click the Save button in the preview window in order to persist your configuration.
For the second section, under the penetration testing assessments heading, we’ll first create a table. To create a table in Confluence, find the table creation icon on the toolbar at the top of the page (it looks like a small table containing four cells). Create a table with columns following the below structure:
- Date: List month and year of the engagement
- Provider: Lists penetration testing provider with a link to the website or contact email address
- Report: Provides a link to the pentest report, uploaded via the Image, video, or file macro
- Scope: Lists the technology scope of the assessment
- Severity distribution: Provides statistics on the severity distribution of tickets, using the Issue statistics macro
- Remediation status: Provides statistics on the remediation status of tickets, also using the Issue statistics macro
The Issue statistics macro (used in the last two columns) is added to the table in the same way as the Filter Results macro. Like before, click on the + symbol on the toolbar at the top of the page, search the macro by name and select it. When inserting the macro, make sure to place the cursor within the right cell in the table. The macro configuration panel will look almost identical to the Filter Results macro, as shown below:
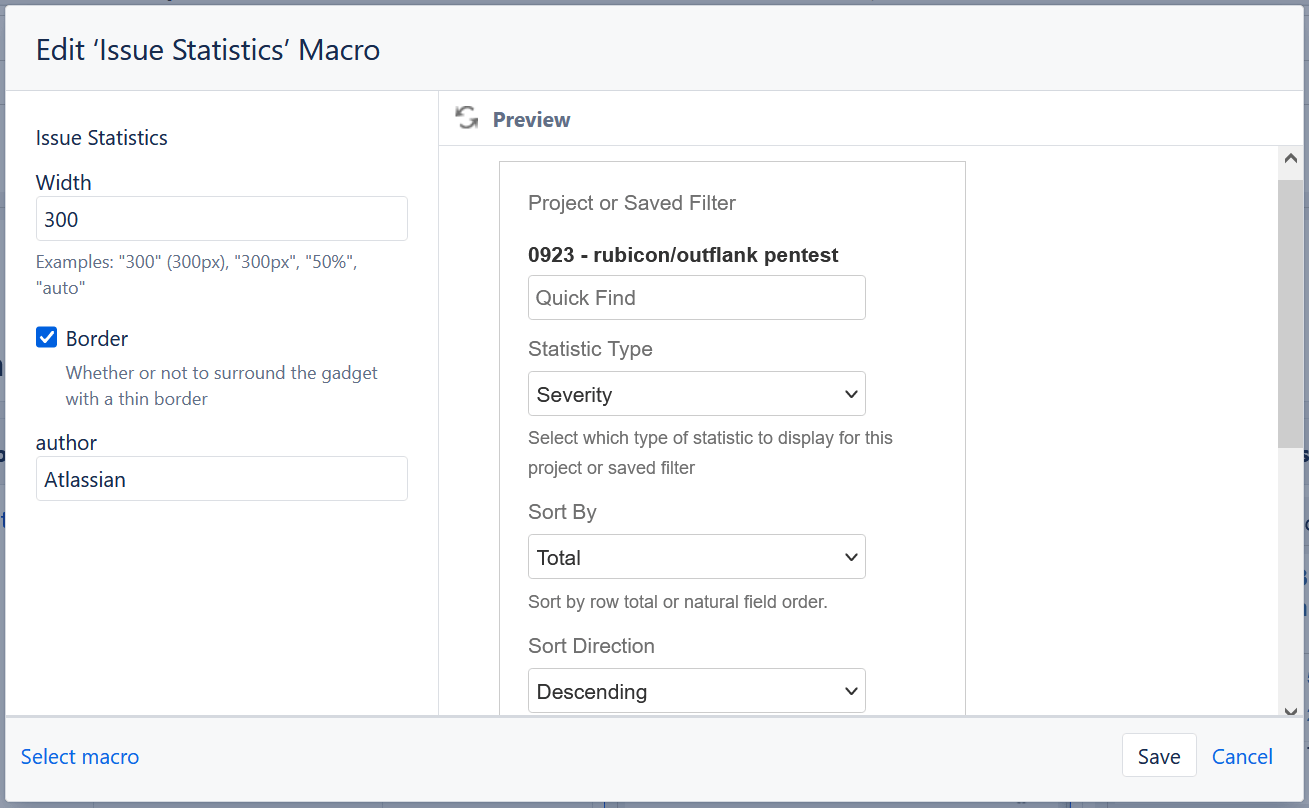
Like the Filter Results macro, you must specify a filter for the macro to populate with data. This is done in the first configuration parameter, called Project or Saved Filter. Just type the name of the relevant Jira filter and select it for the macro to populate with data.
The rest of the macro is then configured in a manner similar to the Filter Results macro. The only exception is the Statistic Type field which should include Severity for the macro in the first column and Resolution for the macro in the second column. In the Show Resolved Issue Statistics field, select Yes. Finally, select the desired Refresh Interval and click Save.
Once all above steps are completed, click the large Publish button at the top-right of the page. If all goes well, you should be presented with a report that looks something like this:
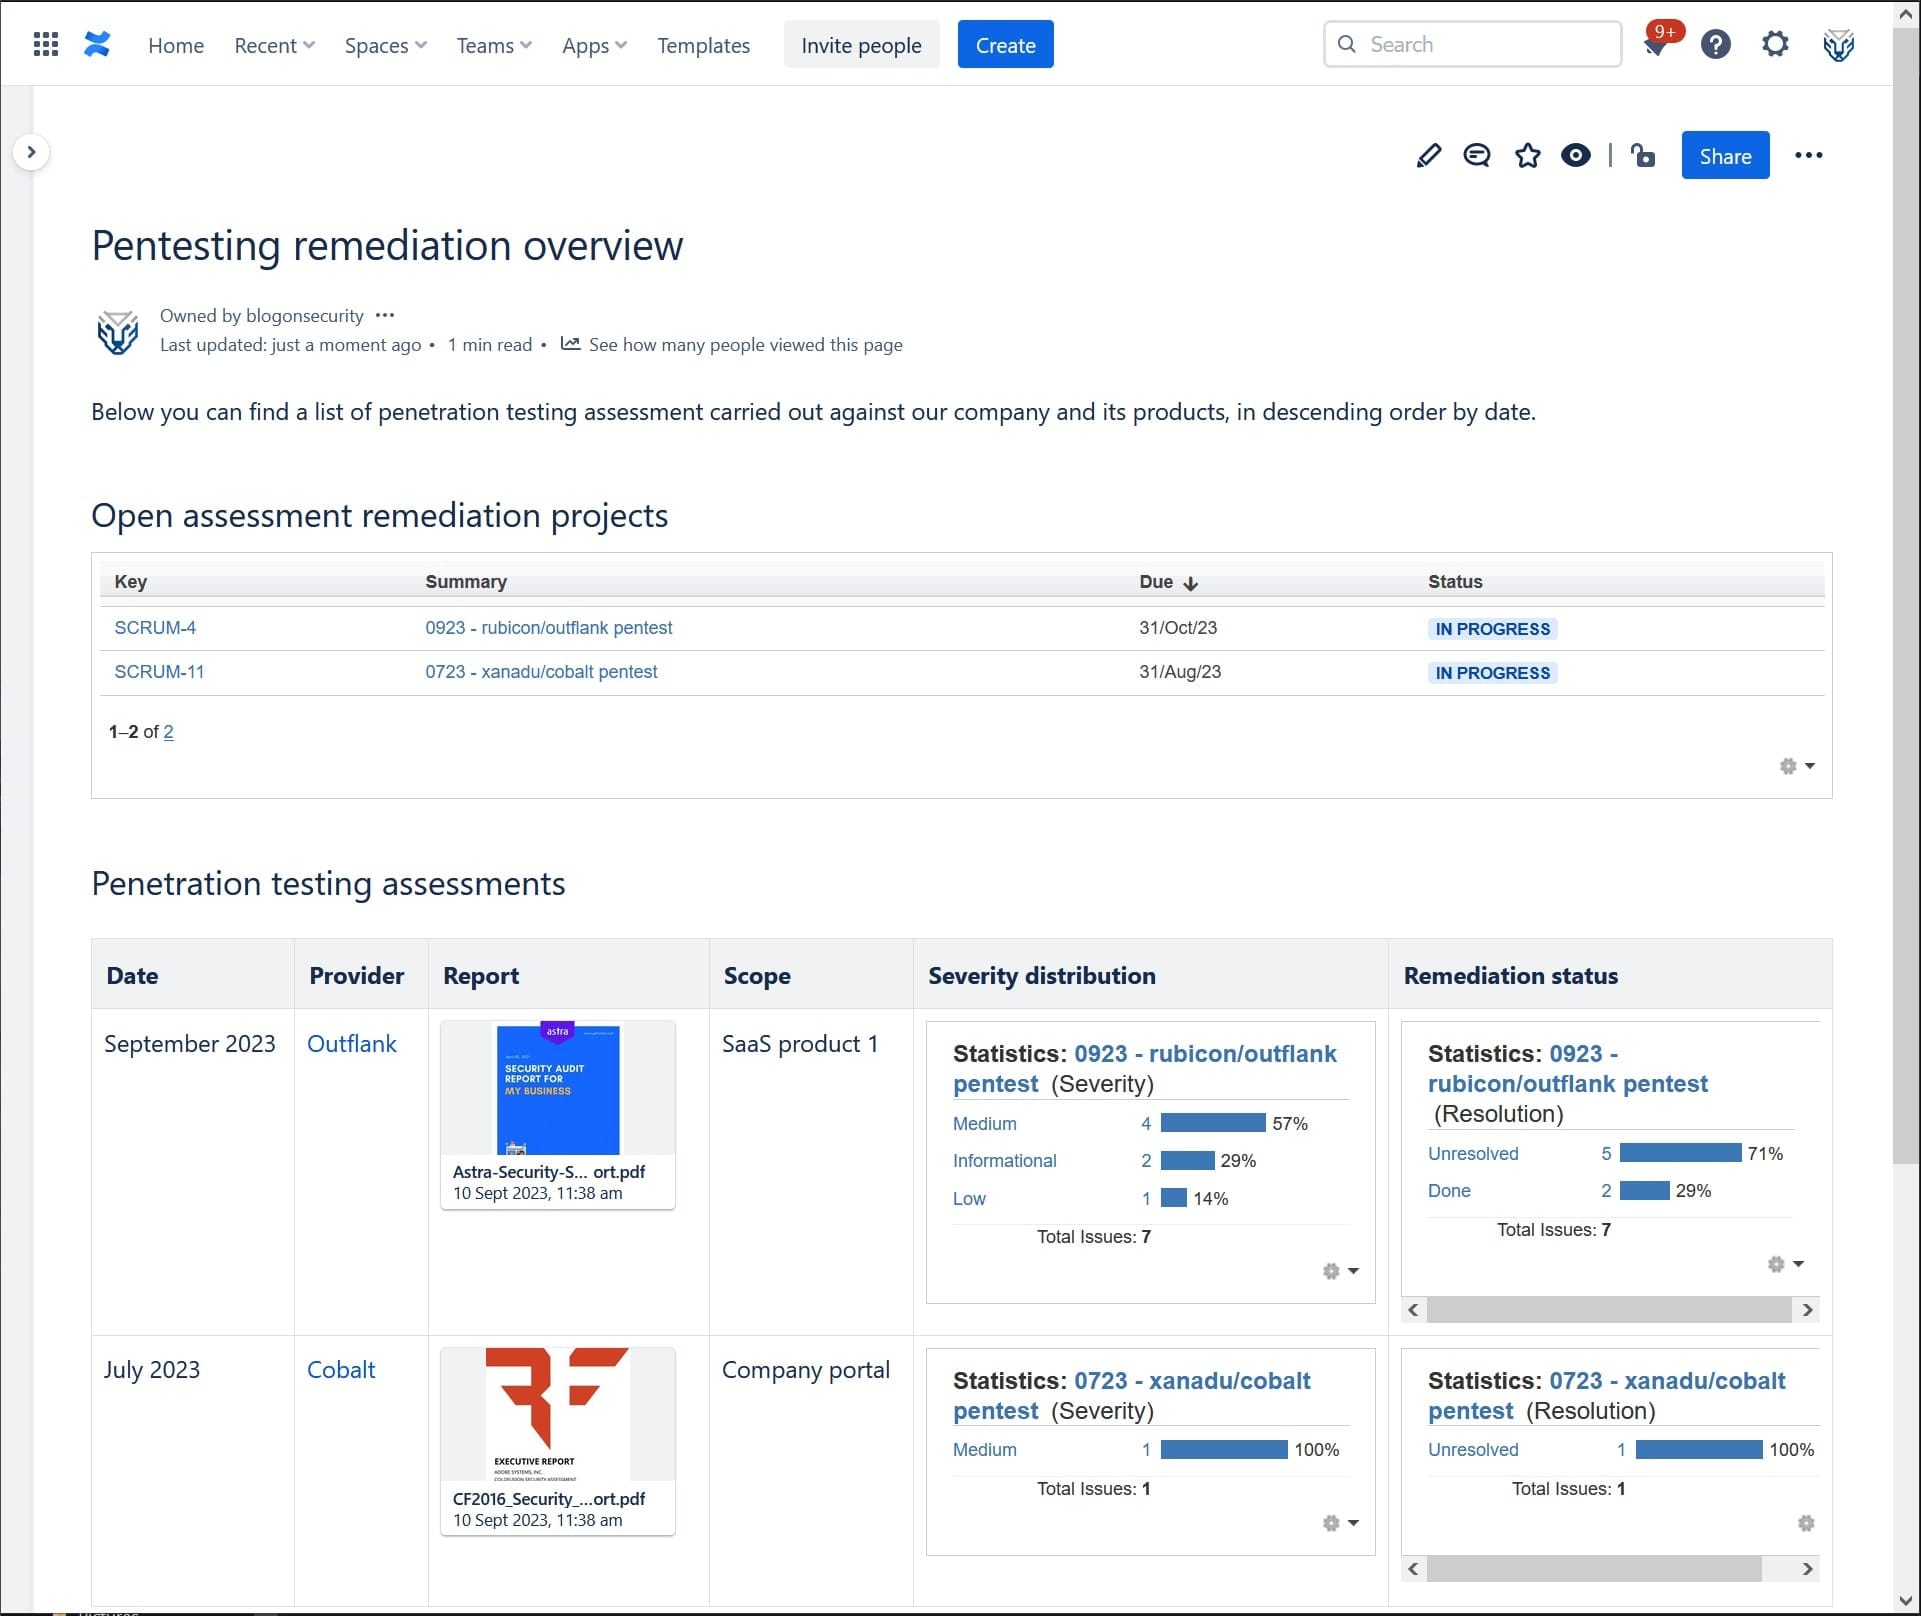
At this point your team will have a simple and powerful report that tracks, in an automated manner, all the statistics for each remediation work stream. If needed, you can couple this Jira system with Confluence to enhance reporting even further. Additionally, you may further streamline the analysis and upload of pentest reports by using AI-based solutions. More importantly, the report will scale over time as more rows are added to the report. Without making large investments to select and onboard a PTaaS solution, your team will process pentest findings in an equally effective manner.